Sunshine
25 Jun 2014tl;dr;
I wrote some code to figure out if a certain geographic location is lit by the sun at a certain date and time, using OpenStreetMap and other free and open data. It can make pretty maps and videos. I made it fast enough to figure this out for all locations in a small city in a couple of seconds. Doing this in C is five hundred times faster than in Python. Below are some explanations on why and how.
If you’re more into code, I put everything up on GitHub: check out Shadow Mapper.
Ok, why?
About a year ago, I overheard two former colleagues of mine, Johan Lennerås and Erik Olsson, discussing an idea for an app. The use case was simple: the sun is shining, I’m in the mood for beer (or possibly coffee), but where’s the closest place I can enjoy my beverage of choice in the sun?
At the time, I wrote it off as a nice idea, but too complex for minor gain.
Fast forward a year, and suddenly one of the winners of Open Stockholm Award was an app called “Stolen i solen”, which is exactly this, with some extra twists (like, “where can I eat outside in the sun at seven o’clock this evening”). A bit amused by seeing this idea again, I tweeted about it. However, “Stolen i solen” is just for Stockholm, so started thinking how I could do the same for Gothenburg. (Side note: I later learned that “Stolen i solen” is actually just the idea for an app, no actual implementation…yet.)
So, a couple of evenings of frantic hacking, this is where I’m at:
While the video above is technically incorrect, it looks a lot cooler, and illustrates the concept better, than the accurate version.
I obviously went a bit off on a tangent rendering the shadows for all of Gothenburg instead of finding the sunshine yes/no status for all pubs and restaurants, but it seems reasonable to assume that if I can do this in reasonable computation time (about 18 million light calculations in the video above), I can probably do the same for a hundred restaurants or so.
Ok, how?
Reading about “Solen i stolen”, I thought that someone actually implemented this idea, and it felt like an interesting challenge to figure out how they might have done it, now that I knew it was certainly possible. In retrospect, this probably says something about my approach to problem solving, since I didn’t even try to find a solution until I thought someone else had already proven it was doable (which they in fact hadn’t); I’ll save that thought for another blog post.
As anyone with a fair interest in computer graphics, I knew enough about ray tracing to figure out that the solution lies in tracing the sun’s light rays backwards from the pub or restaurant’s location, to see if it hits another object before reaching the sun; if it does, there’s no sun light there, and if it doesn’t, it might be the perfect spot for you.
Data sources
To do this, we need to know what objects that might be between a location and the sun, and where they are located. In a city environment, shadows are typically cast from buildings, in some cases from terrain like hills, and of course from a combination of them.
Building data was the first thing on my list, and also the first setback: there’s no open, official data on buildings in Gothenburg, neither building footprints or heights. In contrast, “Stolen i solen” was written for Stockholm, which has open 3d data for buildings.
OpenStreetMap was the natural second hand choice, being both open and possible to improve where data is missing. Also, if Gothenburg decides to release open building data, it is likely to end up in OpenStreetMap.
Data for hills can be obtained through elevation data. The best source I’ve found for open elevation data is Virtual Terrain Project, where I could find reasonably detailed data for Gothenburg.
Height maps
For simplicity, both from a code perspective as well as actual computation, I decided to go with a so called height map. A height map is similar to a bitmap (an image), but instead of storing color information in each pixel, we instead store the height at that point. The similarity with a bitmap of course makes it easy enough to visualize a height map as an image, like this:
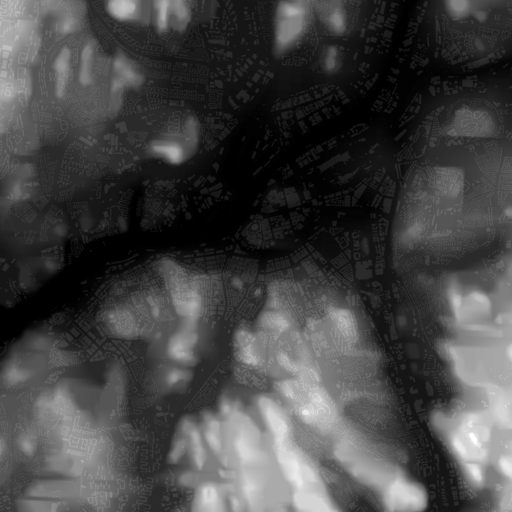
Dark and black areas are sea level or low terrain, while lighter gray to white means higher ground. As can be seen, buildings have also been added, rendered in different color as they add to the height of the ground they are built on.
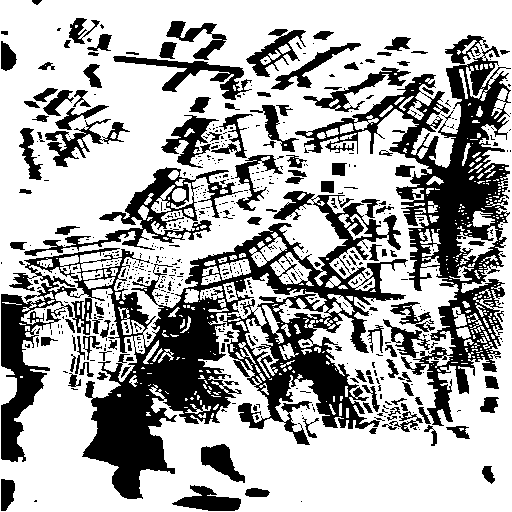
With this heightmap and the angle of the sun, we can do the ray tracing, stepping pixel by pixel along the ray, and comparing the ray’s height at that point to the height found in the height map at that location - if the ray is above, it hasn’t been shadowed, otherwise it has. If a ray goes outside the height map without going below the height map, the origin is a spot that is lit by the sun. Going through all the pixels of the height map like this renders a so called shadow map, in this simple case colored black for shadows and white for sunlight:
Technical details
The general principle described above is pretty straight forward, but putting these pieces together turned out to involve a bit more than I had anticipated. Lots and lots of open source libraries where used to put together the end result.
Elevation data from the Virtual Terrain Project was stored in .hgt files. Some abandoned Python code for reading SRTM data (which is also .hgt files) turned out to do almost what I wanted, except that VTP’s files are of different dimensions.
Building data from OpenStreetMap could be obtained using the Overpass API. Using the overpass turbo site is straight forward, but very much not suitable for downloading all buildings in even a small city like Gothenburg. I haven’t found an easy way of turning the overpass data into easily renderable polygons yet, so my solution builds on the Node.js module osmtogeojson. I plan to publish the small module I use to query Overpass and turn the result into GeoJSON. I’ve published query-overpass to turn the result from a overpass query into GeoJSON.
pyproj was used to handle projection from latitudes and longitudes (WGS84) to a local coordinate system (SWEREF99 TM/EPSG:3006) where I could use meters as units, to make calculations a lot simpler. Also important for making images look better.
Rendering the height map was straight forward with the software mentioned combined with NumPy and Pillow. I got this far in a single night’s work.
The sun’s position can of course be calculated with well known formulas, but they’re far from easy to understand. I cheated and skipped learning much about it: instead I ported parts of Vladimir Agafonkin’s JavaScript library SunCalc to Python (and spent a little too much time playing with his site suncalc.net).
Rendering the shadow map was also quick and easy when I already had the height map code, except for some pretty important details outlined below.
Generating a background map wasn’t really crucial to the project, but still sort of important to get an orientation of what the shadow map really meant. As mentioned above, I used a local coordinate system, so I had to follow my own guide to using TileMill and Mapnik with local coordinate systems. I used OSM Bright as it’s a nice style and pretty easy to setup.
Video was put together from the images rendered by a small script and using avconv.
Performance
Python is great for hacking together stuff like this: lots of open code and libraries available, the code you write is to the point and mostly avoids boilerplate.
However, it also turns out that Python is slow. I mean, really, awfully, horribly slow. I’ve grown used to that performance rarely matters for the things I code, and even where it matters, you can get away with choosing the right algorithm.
In this case, it turned out that algorithm wasn’t going to help. After implementing the first version, I was able to verify that I was on the right track when I found an article about fast computation of terrain shadow maps, which more or less describes exactly what I already did.
I tried optimizing things by limiting the use of floating point calculations, implementing the tracing of the rays using Bresenham’s line algorithm. This improved rendering times significantly, but was still intolerable.
I found this article on even faster computation of terrain shadow maps and thought about implementing it, but realized that the main problem wasn’t the algorithm, but the implementation language.
For the first time in years, I wrote some C code, and made it interface with the Python I already had, so that I just had to implement the core calculation algorithm.
Bam, rendering in C is about FIVE HUNDRED TIMES faster than in Python. A bit more difference than I expected.
Next steps
As some might have noticed, I sorted of deviated from the original idea of finding pubs and restaurants in the sun. Producing pretty maps and animations is just too much fun.
Anyway, I have some sort of plan of returning to the initial goals, and hacking together a way to find interesting sun spots. Perhaps publish a web interface.
As mentioned above, you can find the code and start fiddeling with it yourself: Shadow Mapper.