Making Orienteering Maps for the Web
05 Jan 2022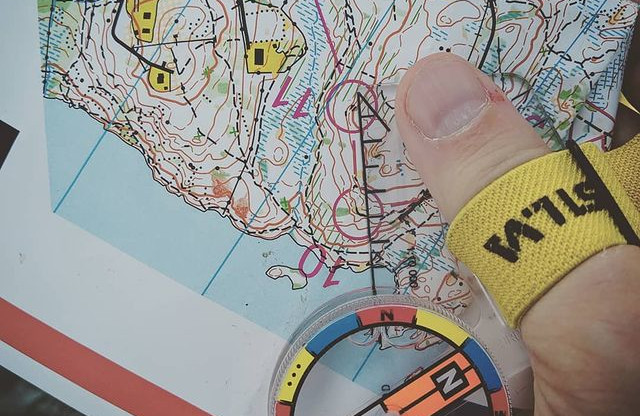
This is a project I’ve been working for on and off for at least three years now, but never really made an effort to document it or talk about it, so let’s do that!
Ok, but why?
Orienteering maps a mostly made using a proprietary, Windows only software called OCAD. Being a Linux only kind of guy, hating proprietary formats with a passion, something had to be done when I joined an orienteering club a couple of years ago.
How
Ok, so there’s like a million things I want to tell you about how OCAD files work, and the process of getting them to render as a web map or just a bitmap image. But you just want the pretty pictures, so let’s skip ahead and leave the technical details for another day.
Installing stuff
This being targeted at the web, of course I wrote it in JavaScript. So, you need a newish version of Node (12? Maybe 10. At least not a really old version.) and npm installed.
Of course, you’ll also need an OCAD map file (.ocd) to experiment with. Since these are commonly copyrighted and hard to get your hands on, I recommend experimenting with one of Stefan Kinell’s maps (sorry, swedish only). I used Styrsö below. Be sure to respect his license, though - basically: free to use unless you plan to make money out of it somehow.
Making an image
The first tool to get acquainted with is ocad2image, which is… well, a tool to convert an OCAD map to an image. A lot of formats are supported, but most importantly PNG, SVG and JPEG (you probably want to go with the two first ones).
Try it out:
npx ocad2image path/to/my-ocad-map.ocd test.png
So, you should have a nice PNG with the map, where the resolution is 1 pixel / unit in whatever coordinate system your map uses (which means 1 pixel/meter for all maps I’ve seen, but I’m not sure it’s always true).
For most maps, that means it will be fairly large, so you can create a more reasonably sized image by setting the resolution:
npx ocad2image --resolution 8 path/to/my-ocad-map.ocd test.png
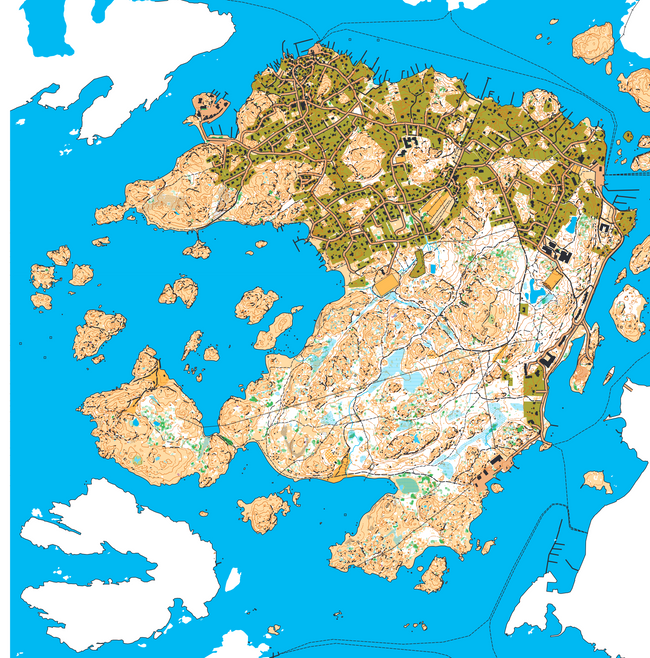
If you used Stefan’s Styrsö map that I linked above, you’ll notice there’s a lot of empty space at the top of the image. This is because there are objects there, but they are hidden. ocad2image isn’t (yet) smart enough to figure that out, but you can override the calculated bounds:
npx ocad2image --resolution 8 --bounds 305500,6388080,308750,6391370 styrsö.ocd styrsö.png
(Those bounds and paths will obviously have to be adjusted depending on the map you use.)
So, that looks nice, but depending on the image viewer you’re using, you might have noticed the map has a checkerboard pattern showing through. This is related to OCAD’s focus on producing paper maps. It assumes the background is white (which paper usually is). When we draw a digital image, the background is default transparent. There’s an option to change this, though:
npx ocad2image --fill white --resolution 8 --bounds 305500,6388080,308750,6391370 styrsö.ocd styrsö.png
(Typing this, I might actually make that the default, although you sometime want the transparency.)
Ooo, that’s nice, right? But also kind of cluttered and hard to see the details. If you on the other hand try to render a complete map with very low values for resolution (very detailed), the image will be huge and in fact often just crash the tool.
Tiles to the rescue
We’ve been here before, and the solution is tiled maps. That is, divide the huge image into smaller ones.
Using tiled maps is a pretty huge topic in itself, the extremely short summary is to look at using Leaflet or OpenLayers if you don’t know what you’re doing. Whichever you decide, you need the actual tiled images, which you use ocad2tiles for.
Let’s try it out:
npx ocad2tiles --fill white --serve path/to/my-ocad-map.ocd my-tiles-directory/
This will start a local web server on your machine, and you can direct your browser to http://localhost:8080/ to see it live. This way, you can zoom and pan around the map, and the server will produce the required tiles and store the in the directory you specified. Note that the contents of the directory is preserved between runs, so if you don’t clear the tiles, they will be reused the next time you launch the tool (which can be confusing if you altered settings between runs).
You can also check the source of the page with your browser’s View Source, it’s a quite minimal Leaflet example that’s needed.
If you plan to use the tiles in your website, you don’t want to to interactively pan around the map but just render all tiles in one swoop and upload to your server. Remove the --serve parameter:
npx ocad2tiles --fill white path/to/my-ocad-map.ocd my-tiles-directory/
This will take a little while, since there’s likely a couple of hundred tiles to render. Again, this will reuse any tiles already present in you directory, so clear it between runs unless you’re satisfied with what’s already there.
The tools ocad2tiles and ocad2image are both part of the same NPM package ocad2tiles (the image tool is sort of a side effect of creating the tiles). You can of course use it directly from JavaScript if you have more complex needs.
Feel free to contact me or post an issue on the repo if you have questions or problems with generating your maps!