05 Jan 2022
This is a project I’ve been working for on and off for at least three years now, but never really made an effort to document it or talk about it, so let’s do that!
Ok, but why?
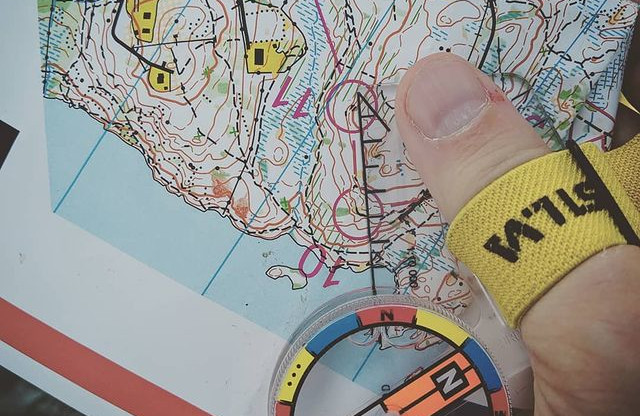
Orienteering maps a mostly made using a proprietary, Windows only software called OCAD. Being a Linux only kind of guy, hating proprietary formats with a passion, something had to be done when I joined an orienteering club a couple of years ago.
How
Ok, so there’s like a million things I want to tell you about how OCAD files work, and the process of getting them to render as a web map or just a bitmap image. But you just want the pretty pictures, so let’s skip ahead and leave the technical details for another day.
Installing stuff
This being targeted at the web, of course I wrote it in JavaScript. So, you need a newish version of Node (12? Maybe 10. At least not a really old version.) and npm installed.
Of course, you’ll also need an OCAD map file (.ocd) to experiment with. Since these are commonly copyrighted and hard to get your hands on, I recommend experimenting with one of Stefan Kinell’s maps (sorry, swedish only). I used Styrsö below. Be sure to respect his license, though - basically: free to use unless you plan to make money out of it somehow.
Making an image
The first tool to get acquainted with is ocad2image, which is… well, a tool to convert an OCAD map to an image. A lot of formats are supported, but most importantly PNG, SVG and JPEG (you probably want to go with the two first ones).
Try it out:
npx ocad2image path/to/my-ocad-map.ocd test.png
So, you should have a nice PNG with the map, where the resolution is 1 pixel / unit in whatever coordinate system your map uses (which means 1 pixel/meter for all maps I’ve seen, but I’m not sure it’s always true).
For most maps, that means it will be fairly large, so you can create a more reasonably sized image by setting the resolution:
npx ocad2image --resolution 8 path/to/my-ocad-map.ocd test.png
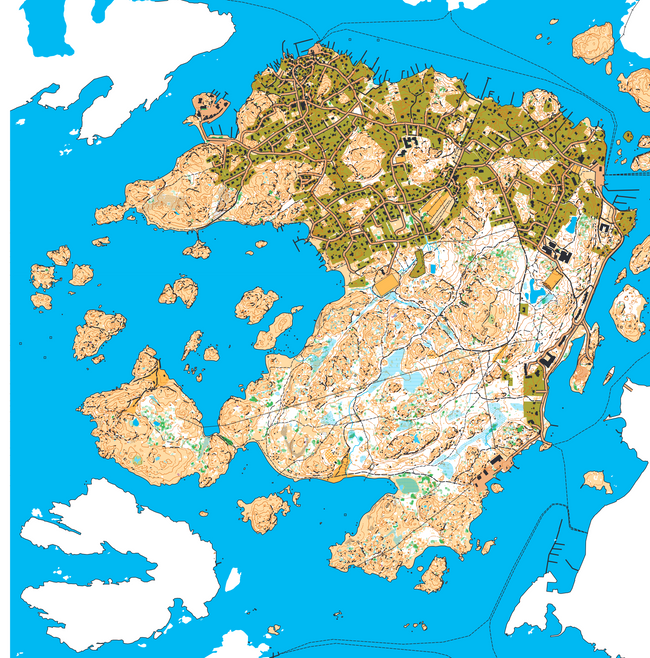
If you used Stefan’s Styrsö map that I linked above, you’ll notice there’s a lot of empty space at the top of the image. This is because there are objects there, but they are hidden. ocad2image isn’t (yet) smart enough to figure that out, but you can override the calculated bounds:
npx ocad2image --resolution 8 --bounds 305500,6388080,308750,6391370 styrsö.ocd styrsö.png
(Those bounds and paths will obviously have to be adjusted depending on the map you use.)
So, that looks nice, but depending on the image viewer you’re using, you might have noticed the map has a checkerboard pattern showing through. This is related to OCAD’s focus on producing paper maps. It assumes the background is white (which paper usually is). When we draw a digital image, the background is default transparent. There’s an option to change this, though:
npx ocad2image --fill white --resolution 8 --bounds 305500,6388080,308750,6391370 styrsö.ocd styrsö.png
(Typing this, I might actually make that the default, although you sometime want the transparency.)
Ooo, that’s nice, right? But also kind of cluttered and hard to see the details. If you on the other hand try to render a complete map with very low values for resolution (very detailed), the image will be huge and in fact often just crash the tool.
Tiles to the rescue
We’ve been here before, and the solution is tiled maps. That is, divide the huge image into smaller ones.
Using tiled maps is a pretty huge topic in itself, the extremely short summary is to look at using Leaflet or OpenLayers if you don’t know what you’re doing. Whichever you decide, you need the actual tiled images, which you use ocad2tiles for.
Let’s try it out:
npx ocad2tiles --fill white --serve path/to/my-ocad-map.ocd my-tiles-directory/
This will start a local web server on your machine, and you can direct your browser to http://localhost:8080/ to see it live. This way, you can zoom and pan around the map, and the server will produce the required tiles and store the in the directory you specified. Note that the contents of the directory is preserved between runs, so if you don’t clear the tiles, they will be reused the next time you launch the tool (which can be confusing if you altered settings between runs).
You can also check the source of the page with your browser’s View Source, it’s a quite minimal Leaflet example that’s needed.
If you plan to use the tiles in your website, you don’t want to to interactively pan around the map but just render all tiles in one swoop and upload to your server. Remove the --serve parameter:
npx ocad2tiles --fill white path/to/my-ocad-map.ocd my-tiles-directory/
This will take a little while, since there’s likely a couple of hundred tiles to render. Again, this will reuse any tiles already present in you directory, so clear it between runs unless you’re satisfied with what’s already there.
The tools ocad2tiles and ocad2image are both part of the same NPM package ocad2tiles (the image tool is sort of a side effect of creating the tiles). You can of course use it directly from JavaScript if you have more complex needs.
Feel free to contact me or post an issue on the repo if you have questions or problems with generating your maps!
04 Apr 2016
I love reveal.js, and I’ve made a couple of presentations with it over the last couple of months. All of them have included live code examples with Leaflet.js maps in them. Since it wasn’t entirely obvious how to make that work, I thought documenting how to go about it here was a good idea.
Prerequisites
Like any page that uses Leaflet, you’re going to have to load Leaflet’s stylesheet and the JavaScript. Just add them to your reveal.js HTML file.
I added the leaflet.css stylesheet to load after reveal.css and the theme stylesheet, etc.
I include the leaflet.js (or perhaps leaflet-src.js, if you plan on debugging something) right after reveal.js; it might be better to load it through dependencies, but I’m always in too much of a hurry to bother trying that out. Loading it with a normal script tag will work fine.
Adding a map
To create a map on a slide, just create a div tag with an id of your choice on any slide, just like you would when creating any Leaflet map. Make sure to add some styling to that div, so it actually gets a size (this applies to any Leaflet container, also outside reveal.js); personally I use a CSS class called map to give it appropriate size. Also, create another script tag that includes the script that initializes your map. This simple “hello world” map should (sort of, see next paragraph) work, given that you add a <div id="map-test" class="map"></div> to one of your slides:
var map = L.map('map-test').setView([0, 0], 2);
L.tileLayer('http://{s}.tile.osm.org/{z}/{x}/{y}.png', {
attribution: '© <a href="http://osm.org/copyright">OpenStreetMap</a> contributors'
}).addTo(map);
Now, have a look at the result.
Ok, yeah, so that’s why decided to write this post. Out of the box, a lot of reveal.js’ styling interferes with Leaflet’s styling, making the map unusable.
The problem is that some of reveal.js’ styles for img tags and some other things have higher specificity than Leaflet’s, which makes them override Leaflet.
Overriding reveal.js’ builtin styling for maps
What I’ve done to avoid this, is to re-add a copy of Leaflet’s CSS rules with the extra selectors .reveal .leaflet-container as prefix, which gives these rules higher specificity than reveal.js’ rules. This means the map will use the Leaflet styling, while other elements, outside maps, will still use reveal.js’ style.
Here are the style overrides I use:
Ok, nice? Yes. But do you notice something still a bit off?
At least on some screens, your Leaflet map will appear blurry, and even worse: popups and other graphic elements might appear in the wrong place on your map.
Un-zooming reveal.js’ zooming
This is because reveal.js has a trick where it scales or zooms the entire view, to make it fit on your screen, and make it less dependant on the exact resolution your presentation runs on. For normal presentations, this is a fantastic function, but as mentioned above it becomes trouble for Leaflet maps.
To address this, I’ve added a hook to Leaflet’s map constructor, making sure its container is zoomed out just enough to counter reveal.js zoom in, so that the combined scale factor is exactly 1. This makes map tiles look crisp again, and makes sure screen coordinates and lat/lngs match up as expected.
This is it! With this code, I have happily included maps in my last two presentation: Let’s Learn Leaflet.js and Making Tiled Maps Come Alive: Leaflet Underneath.
Hope this helps your presentations as well!
13 Apr 2015
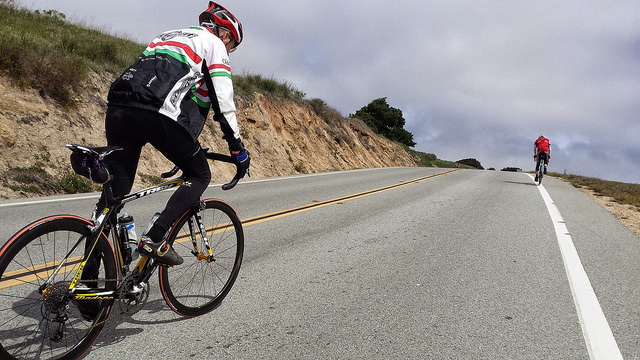 Photo by Richard Masoner - licensed under
Creative Commons by-sa
Photo by Richard Masoner - licensed under
Creative Commons by-sa
OSRM is a quite impressive routing software: it is open source, it is
extremely fast, and it is also very configurable and extensible. I’ve worked with it quite a lot
in the last year, creating my by far most ambitious open source project,
Leaflet Routing Machine.
Recently, I’ve started working on a new hobby project that uses both Leaflet Routing Machine
as well as OSRM, a bike planner for Sweden, built on OpenStreetMap data and open source
software - it’s called cykelbanor.se (cykelbanor means “bike lanes” in
swedish).
OSRM comes with a profile for bike routing which is pretty good, but one thing that quite
quickly becomes obvious is that any sane bike router has to avoid going too much uphill.
Comparing the results of OSRM to some routes I frequently go by bike gave some
suggestions that someone familiar with the terrain would never give; and Göteborg, where I live,
isn’t even that hilly.
Looking around, there are several OSRM issues that discuss adding elevation data to OSRM
(#271 and
546, for example).
From reading them, and some other posts,
it is apparent that lots of people have worked on this, and some have might have working solutions. However,
I could find no comprehensive documentation on how to actually do this. Well, we have to do
something about that, right?
Process overview
In the end, we need to tell OSRM that the average speed of a road section that is uphill is lower
than a flat one, and that of a downhill road is higher. More specifically, OSRM needs this information
for all ways it should route through, which roughly means all
ways tagged with “highway” (which means some kind of road or path, not an actual highway, in OpenStreetMap parlance).
With this information, OSRM will see that uphill takes longer time (and downhill somewhat shorter),
and route around hills if going uphill doesn’t make the route significantly shorter.
My approach to get this information into OSRM is to add a preprocessing step, which calculates the
amount of uphill and downhill for each way in OpenStreetMap. From reading the issues mentioned above,
it seems I’m far from the first with this approach.
The preprocessing generates a file that the OSRM profile, the code responsible for generating the
travel times for OSRM ways (the “cost” of going a certain way), can read and use. An architectural side
note is that preprocessing, in contrast to integrating this into OSRM, also decouples the actual handling
of raw elevation data from the rest of OSRM, making it easier to test separately and use for other purposes.
So, lets get to the actual implementation. I chose to do this in Node.js, but a lot of other technologies
would probably have worked equally well.
osm-slope
The preprocessing is done by a tool with the somewhat boring name osm-slope. It takes an OpenStreetMap
PBF or OSM XML
file as input, and outputs a JSON file with entries for all ways tagged with the highway tag. You
can download PBF data for your region from for example Geofabrik.
This file serves as a database for the OSRM profile (the lua script) when osrm-extract runs, with the
way’s id as key and the uphill and downhill data (climb and descent) as values.
You can find osm-slope on GitHub.
Custom OSRM profile
The data from osm-slope is used by a custom version of OSRM’s bike profile. I haven’t extracted this
into a separate project, the files are available from
cykelbanor.se’s config. The current
version uses Lua CJSON to read the
database from osm-slope, so you need to install it.
The important parts are, except for the trivial part reading the JSON file, are:
- Getting each way’s elevation data from the database
- Calculating a new max speed for the way
The calculation gets a bit messy since each way can consist of flat parts as well as uphill and downhill.
Note that the current
function for speed depending on gradient
is pretty basic and I’m far from sure it accurately models actual bike physics.
node-hgt
Underlying osm-slope, I wrote a module to handle reading and handling elevation data.
From one of my earlier projects, I had some experience
with working with elevation data in the HGT format,
and knew there was some pretty good data available.
From reading about previous work, I also wanted to make sure my solution offered reasonable performance:
some earlier attempts where apparently quite slow, making the import process run for hours.
Hence, I wrote a small Node module to read HGT files and query them for elevation based on a geographic
coordinate (latitude and longitude). It supports interpolation, since most elevation data is still not
that high resolution.
To improve performance, I also used a memory mapped solution, although to be fair,
I’ve not benchmarked it against doing it some other way.
Finally, it also has a solution for managing and automatically downloading set of HGT files (tiles),
using the nice search tools on imagico.de (you don’t need
to use their web frontend, node-hgt will query it for you).
This module can be used standalone any time you need elevation data, just install
node-hgt:
npm install --save node-hgt
As mentioned earlier, I had some fears adding elevation would be a time consuming process, making
the already quite tedious task of preparing data for OSRM even longer. So far, it’s not been as
bad as I thought.
My numbers comes from handling a complete OSM extract of Sweden, in PBF format. It currently contains
just over 833,000 ways tagged with highway. Test was performed on my more than two year old System76
laptop with - it’s not too bad, but far from high performance.
Preprocessing with osm-slope takes just under three minutes (2:54), and osrm-extract takes 5:55, compared
to the baseline 3:55 it takes with the standard bicycle profile distributed with OSRM. That adds up to
well more than twice the time (+125%), quite a lot although far from as bad as the three hours someone
talked about in previous OSRM discussions (not at all clear what the data size was, though).
Future
Some parts of this toolchain are still a bit hardwired and could use some more config options.
Also, while these tools work great for the dataset I’m using, Sweden, I’m not confident they would
scale to much larger data sets. For example, both osm-slope as well as the OSRM profile hold the
way elevation database in memory, which will obviously not scale well. An idea here could be to
use LevelDB or similar in-process database, to avoid the
overhead of TCP/IP etc.
osm-slope also aggregates data in a way that I’m not entirely sure keeps enough data to calculate
good speeds in all cases. I need to verify this, or store more detailed data.
Bonus points
To actually display the elevation profile in cykelbanor.se, I hacked together a small (you could
say micro) service that takes GeoJSON as input, and adds elevation data to its coordinates.
As everything else, it’s on GitHub: elevation-service,
or you can just post your GeoJSON to http://data.cykelbanor.se/elevation/geojson.
This service was trivial to write when I already had node-hgt.
02 Jul 2014
I’ve spent the last month or so doing a complete rewrite of the route planner for bikes in western Sweden frontend. The new version uses Leaflet heavily, and has been developed with a mobile first as methodology. Large parts of the actual route planning aspects are managed by my own Leaflet plugin Leaflet Routing Machine (abbreviated LRM below).
Some highlights of the functionality: real time updates of available rental bikes near your starting point, as well as free bike stands at your destination (fed by open data from the city of Gothenburg), drag-and-drop for destination markers (drag them from the sidebar) and an elevation graph.
 Photo by Nic Taylor - licensed under Creative Commons by-nc-nd
Short summary: I wish work was always like this. First, the project had no or very few legacy requirements to consider, since we were rewriting from scratch. We got to choose all the tools ourselves: git, Sublime Text and that’s just about it (while everyone else at the company used TFS and Visual Studio - lol). We did not touch the backend parts, but the services the frontend relies on were few and quite easy to work with already. Second, both the customer and the project manager were very positive towards switching from OpenLayers 2, which the old site used, to Leaflet. Third, and probably most important, this proved to be a great opportunity to test LRM both in a real application, as well as adapting it to another backend than OSRM, which it has builtin support for. As a bonus, I live in Gothenburg and cycle as much as I can, so this will be an app that I can and will dog food.
Approach
Even though it wasn’t decided when the project started, it quickly became pretty obvious that Leaflet Routing Machine would be a corner stone of the new app: a lot of the things our app was required to do was already in LRM, and given that we had just about a month to finish the project, any shortcut was welcome. The first days were spent hacking together a rough version with LRM as the base and just swapping out OSRM as its backend and use western Sweden’s Västtrafik’s travel planner, HAFAS from HaCon - believe it or not, Västtrafik’s route planner for public transport can also do route planning for bikes.
After this test, it became natural to build the app more or less as an extension to LRM, adopting mostly the same coding standard, and relying on the same libraries - which means we tried to depend only on Leaflet, LRM and other Leaflet plugins. We didn’t follow through entirely on that concept, and we actually use jQuery in some places to make the code somewhat easier for future maintainers who might not be familiar with Leaflet, and also to keep code easy to read for some places where we deal with legacy browsers like IE 8 and 9.
I also pushed for using Browserify initially, but it was voted down since it isn’t used in the rest of the trafiken.nu site, it doesn’t fit nicely with the current Visual Studio/TFS environment, and is less likely to be known by future maintainers. A bit of a shame, but I can sort of agree with these arguments, although it also means we currently have no solution for bundling and minifying our scripts.
 Photo by Ola Lindberg - licensed under Creative Commons by-nc-sa
Use the plugins, all of them
It’s hard to overstate how much the Leaflet plugin ecosystem helped us in this project - delivering a full-featured, modern map application with mobile support in a couple of hundred hours wouldn’t have been possible without them. Here’s a list of the plugins we’ve used:
- Leaflet Routing Machine - as already mentioned, the plugin the routing UI is built around
- Proj4Leaflet - used for projection support, since trafiken.nu’s maps use SWEREF99 TM projection
- Leaflet.markercluster - some of the map layers contain a lot of markers in a limited area, and this clustering plugin is really nice to work with; the customer was impressed and very happy with the result
- Leaflet.label - for putting labels on some of the markers
- Leaflet.Snap and Leaflet.GeometryUtil - to make it easier to drag markers onto some locations, especially important on mobile where it’s can be hard to place things with precision
- Leaflet.groupedlayercontrol - used since it fits features planned for the future
Why not more open?
So, we built a nice app using all this awesome open source — why isn’t the app itself open source? Good question — while writing this post, I realized I don’t know any good reason why the planner itself couldn’t be open. It could serve as a good example of how to build cool stuff with Leaflet, as well as a way to get new ideas or even bug fixes in from other people than the maintainers. I know I would be interested in contributing. Since this is a publicly funded project, paid by our taxes, I can’t see a good reason the source must remain closed.
My guess is that no one really considered the option, and possibly that it’s hard to see the benefits if you’re not already into open source.
On a more positive note, I managed to submit a few pull requests while doing the app, and LRM got tonnes of fixes and new features from this, that will hopefully benefit some other project in the future, like the other plugins did to ours.
25 Jun 2014
tl;dr;
I wrote some code to figure out if a certain geographic location is lit by the sun at a certain date and time, using OpenStreetMap and other free and open data. It can make pretty maps and videos. I made it fast enough to figure this out for all locations in a small city in a couple of seconds. Doing this in C is five hundred times faster than in Python. Below are some explanations on why and how.
If you’re more into code, I put everything up on GitHub: check out Shadow Mapper.
Ok, why?
About a year ago, I overheard two former colleagues of mine, Johan Lennerås and Erik Olsson, discussing an idea for an app. The use case was simple: the sun is shining, I’m in the mood for beer (or possibly coffee), but where’s the closest place I can enjoy my beverage of choice in the sun?
At the time, I wrote it off as a nice idea, but too complex for minor gain.
Fast forward a year, and suddenly one of the winners of Open Stockholm Award was an app called “Stolen i solen”, which is exactly this, with some extra twists (like, “where can I eat outside in the sun at seven o’clock this evening”). A bit amused by seeing this idea again, I tweeted about it. However, “Stolen i solen” is just for Stockholm, so started thinking how I could do the same for Gothenburg. (Side note: I later learned that “Stolen i solen” is actually just the idea for an app, no actual implementation…yet.)
So, a couple of evenings of frantic hacking, this is where I’m at:
While the video above is technically incorrect, it looks a lot cooler, and illustrates the concept better, than the accurate version.
I obviously went a bit off on a tangent rendering the shadows for all of Gothenburg instead of finding the sunshine yes/no status for all pubs and restaurants, but it seems reasonable to assume that if I can do this in reasonable computation time (about 18 million light calculations in the video above), I can probably do the same for a hundred restaurants or so.
Ok, how?
Reading about “Solen i stolen”, I thought that someone actually implemented this idea, and it felt like an interesting challenge to figure out how they might have done it, now that I knew it was certainly possible. In retrospect, this probably says something about my approach to problem solving, since I didn’t even try to find a solution until I thought someone else had already proven it was doable (which they in fact hadn’t); I’ll save that thought for another blog post.
As anyone with a fair interest in computer graphics, I knew enough about ray tracing to figure out that the solution lies in tracing the sun’s light rays backwards from the pub or restaurant’s location, to see if it hits another object before reaching the sun; if it does, there’s no sun light there, and if it doesn’t, it might be the perfect spot for you.
Data sources
To do this, we need to know what objects that might be between a location and the sun, and where they are located. In a city environment, shadows are typically cast from buildings, in some cases from terrain like hills, and of course from a combination of them.
Building data was the first thing on my list, and also the first setback: there’s no open, official data on buildings in Gothenburg, neither building footprints or heights. In contrast, “Stolen i solen” was written for Stockholm, which has open 3d data for buildings.
OpenStreetMap was the natural second hand choice, being both open and possible to improve where data is missing. Also, if Gothenburg decides to release open building data, it is likely to end up in OpenStreetMap.
Data for hills can be obtained through elevation data. The best source I’ve found for open elevation data is Virtual Terrain Project, where I could find reasonably detailed data for Gothenburg.
Height maps
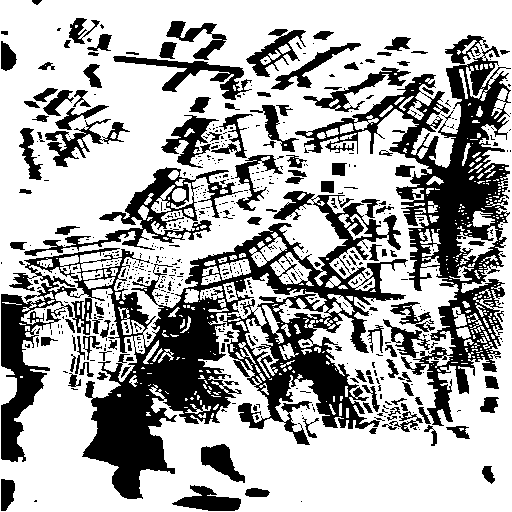
For simplicity, both from a code perspective as well as actual computation, I decided to go with a so called height map. A height map is similar to a bitmap (an image), but instead of storing color information in each pixel, we instead store the height at that point. The similarity with a bitmap of course makes it easy enough to visualize a height map as an image, like this:
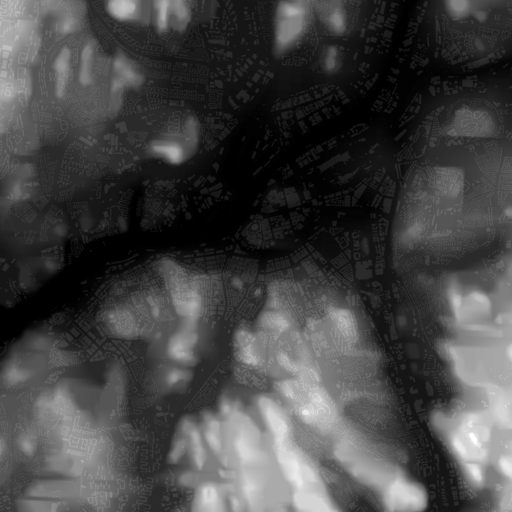
Dark and black areas are sea level or low terrain, while lighter gray to white means higher ground. As can be seen, buildings have also been added, rendered in different color as they add to the height of the ground they are built on.
With this heightmap and the angle of the sun, we can do the ray tracing, stepping pixel by pixel along the ray, and comparing the ray’s height at that point to the height found in the height map at that location - if the ray is above, it hasn’t been shadowed, otherwise it has. If a ray goes outside the height map without going below the height map, the origin is a spot that is lit by the sun. Going through all the pixels of the height map like this renders a so called shadow map, in this simple case colored black for shadows and white for sunlight:
Technical details
The general principle described above is pretty straight forward, but putting these pieces together turned out to involve a bit more than I had anticipated. Lots and lots of open source libraries where used to put together the end result.
Elevation data from the Virtual Terrain Project was stored in .hgt files. Some abandoned Python code for reading SRTM data (which is also .hgt files) turned out to do almost what I wanted, except that VTP’s files are of different dimensions.
Building data from OpenStreetMap could be obtained using the Overpass API. Using the overpass turbo site is straight forward, but very much not suitable for downloading all buildings in even a small city like Gothenburg. I haven’t found an easy way of turning the overpass data into easily renderable polygons yet, so my solution builds on the Node.js module osmtogeojson. I plan to publish the small module I use to query Overpass and turn the result into GeoJSON. I’ve published query-overpass to turn the result from a overpass query into GeoJSON.
pyproj was used to handle projection from latitudes and longitudes (WGS84) to a local coordinate system (SWEREF99 TM/EPSG:3006) where I could use meters as units, to make calculations a lot simpler. Also important for making images look better.
Rendering the height map was straight forward with the software mentioned combined with NumPy and Pillow. I got this far in a single night’s work.
The sun’s position can of course be calculated with well known formulas, but they’re far from easy to understand. I cheated and skipped learning much about it: instead I ported parts of Vladimir Agafonkin’s JavaScript library SunCalc to Python (and spent a little too much time playing with his site suncalc.net).
Rendering the shadow map was also quick and easy when I already had the height map code, except for some pretty important details outlined below.
Generating a background map wasn’t really crucial to the project, but still sort of important to get an orientation of what the shadow map really meant. As mentioned above, I used a local coordinate system, so I had to follow my own guide to using TileMill and Mapnik with local coordinate systems. I used OSM Bright as it’s a nice style and pretty easy to setup.
Video was put together from the images rendered by a small script and using avconv.
Python is great for hacking together stuff like this: lots of open code and libraries available, the code you write is to the point and mostly avoids boilerplate.
However, it also turns out that Python is slow. I mean, really, awfully, horribly slow. I’ve grown used to that performance rarely matters for the things I code, and even where it matters, you can get away with choosing the right algorithm.
In this case, it turned out that algorithm wasn’t going to help. After implementing the first version, I was able to verify that I was on the right track when I found an article about fast computation of terrain shadow maps, which more or less describes exactly what I already did.
I tried optimizing things by limiting the use of floating point calculations, implementing the tracing of the rays using Bresenham’s line algorithm. This improved rendering times significantly, but was still intolerable.
I found this article on even faster computation of terrain shadow maps and thought about implementing it, but realized that the main problem wasn’t the algorithm, but the implementation language.
For the first time in years, I wrote some C code, and made it interface with the Python I already had, so that I just had to implement the core calculation algorithm.
Bam, rendering in C is about FIVE HUNDRED TIMES faster than in Python. A bit more difference than I expected.
Next steps
As some might have noticed, I sorted of deviated from the original idea of finding pubs and restaurants in the sun. Producing pretty maps and animations is just too much fun.
Anyway, I have some sort of plan of returning to the initial goals, and hacking together a way to find interesting sun spots. Perhaps publish a web interface.
As mentioned above, you can find the code and start fiddeling with it yourself: Shadow Mapper.