10 Apr 2013
This text was originally posted on my previous employer's blog (Kartena), but since they've closed it down, I'm publishing it here as well.
TileMill is a fantastic design tool for styling maps. It is created by MapBox, it is free and open source.
At Kartena, we've been looking to replace our current styling and rendering pipeline for tiled maps for quite a while. There are plenty of shiny solutions out there (and quite a few less shiny, to be honest), but TileMill has always seemed like the best fit to our needs.
Well, best fit except for one detail: TileMill
officially only supports Spherical Mercator.
Kartena mainly does maps for a Swedish audience, and many of our customers are government agencies, local transport organizations and so on. In these organizations, the local Swedish projections RT 90 and SWEREF 99 TM are de facto standards. Also, we're that far north that Mercator's distortion becomes quite visible in northern parts of Sweden, which just doesn't look right if you have a touch of design OCD.
Luckily for us, you can actually trick TileMill into doing other projections than Spherical Mercator. I honestly don't know if this is by design from MapBox, or whether it's applicable to all projections, but at least it works well enough for RT 90 and SWEREF 99 TM if you can accept some hacking and UI weirdness.
Setting up the project's projection
The first step to get going is to set up the projection for your project. This change can't be done through TileMill's user interface, since it isn't really supported. You will have to hack the project's settings file manually.
First locate your project's settings file. We're
running TileMill as a service on Ubuntu, and the projects' files are stored under
/usr/share/mapbox/project. Each project has its own directory, and the main project file has the extension
mml. For example, our project LMV Bright has its project settings in
/usr/share/mapbox/project/lmv-bright/project.mml.
Open the project settings file in an editor. The file is JSON, and you're looking for the project's SRS (Spatial Reference System) declaration, which will look like this:
"srs": "+proj=merc +a=6378137 +b=6378137 +lat_ts=0.0 +lon_0=0.0 +x_0=0.0 +y_0=0 +k=1.0 +units=m +nadgrids=@null +wktext +no_defs +over"
The default definition is the
PROJ.4 definition of EPSG:3857 / Spherical Mercator.
By changing this line into the Proj.4 definition you want, TileMill (or
Mapnik, which TileMill uses in the background, to be exact) will use your projection rendering your data. You can find the Proj.4 definition on
Spatial Reference if you don't already have it.
Are we done?
Simple enough, ey? No, not really. If it were that easy, MapBox would of course have built in projection support and officially supported it.
As Tom MacWright notes in the support answer referenced above, the details of tiling maps with projections other than spherical mercator is
messy to say the least, mostly because there's simply no standard.
What this means is that TileMill's map will continue to assume that Spherical Mercator is being used, and latitudes and longitudes will continue to show as if you were using Spherical Mercator. The underlying renderer, Mapnik, will however reproject according to the specified projection, since it has full projection support.
Why and how this works
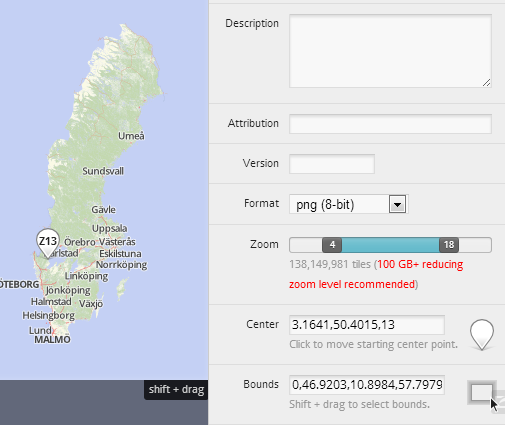
In practice, this means that your data will show up in some weird part of the world, possibly very weirdly scaled. TileMill will assume your data's coordinates are spherical mercator and treat them as such when transforming them to latitudes and longitudes. For example, as can be seen in this image, TileMill's idea of Sweden's lat/lon bounds is completely off. Depending on your projection, the scales might also be very weird.
In fact, I guess that for projections where the data ends up outside the projected coordinate space for spherical mercator, simply will not work at all.
The result of this is that it might be a bit hard to first find your data, since it's easily lost in all the blue emptiness when you can't use the correct geographic coordinates.
Caveats
For RT 90 and SWEREF 99 TM, these issues are minor in our experience. You have to know that these issues exist and it's a bit tricky when starting, but once you get used to it, it is actually no issue at all. One important point here is that both RT 90 and SWEREF 99 TM use meters as units; so does spherical mercator, or at least pseudo-meters. This means that the scales for different zoom levels in spherical mercator matches reasonably with the scales you would use in RT 90/SWEREF 99 TM. I guess that this could be a real issue for projections with other units, although we have no experience with that.
Also, all forms of tile export that is built into TileMill will be more or less broken when working like this. The tiles and lat/lon mapping will be equally weird for exported tiles as they are when shown inside TileMill. Theoretically I guess you could compensate for when using the tiles, but just thinking about it gives me a headache. Would not recommend it.
MBTiles is an attractive MapBox/TileMill feature for creating portable tile sets, but it also explicitly does not support anything but spherical mercator. Extending it with projection support is on my (pretty long) list of things I wish I had time for.
Exporting tiles
So, why would you use TileMill if you can't export tiles from it? Well, you can export tiles, but you have to do it manually, or at least know how to use other tools for it.
As already mentioned, TileMill uses Mapnik in the background to render the tiles, and Mapnik has fullblown projection support. The trick is to export the Mapnik XML from TileMill, and then use Mapnik directly to render the actual tiles.
At Kartena, we do this with our tile cache,
TileStache, which
can use Mapnik to render tiles. Since we've extended
TileStache with projection support, this works entirely as expected. Details on how to set that up is the topic for another blog post though.
Mapnik is very friendly to integration, so you can also do this in a myriad of other fashions, if you like.
Proof of concept
Ok finally, to show you that this isn't just empty talk, here's a
demo of two layers styled in TileMill, using SWEREF 99 TM (ESPG:3006) projection.
Have you done something similar with TileMill or have questions? We're eager to here from you in the comments below.
02 Jul 2012
This text was originally posted on my previous employer's blog (Kartena), but since they've closed it down, I'm publishing it here as well.
Update 2014-02-24: A more thorough and updated version on the topic is
The Hitchhiker's Guide to Tiled Maps.
The premise: you want to use the new and cool open source mapping solutions like Leaflet, TileStache and TileMill. While you love projects like OpenStreetMap, you are in a position where you cannot throw out your old map tiles, that are rendered in some local projection, instead of the the one projection to rule them all, spherical mercator. You need to coerce these tools to use your projection and your tiles.
Fortunately, these tools
do support local projections, or at least were designed with this support in mind. Yay! Less fortunately, it seems very few actually use that functionality, and if they do, they are not bloggers, since we at Kartena couldn't find any useful information on how to go about configuring local projections. That's why we're here! We want to share the wonderful world of local projections with you.
What are projections?
A projection (in cartography) is a way of transforming a location on the earth, typically described by a latitude and longitude, to a flat surface (a map) coordinate, like x and y. Projections come in a myriad and shapes and flavors, and different projections have different advantages and disadvantages (you can
read up on that on Wikipedia, for example).
What is tiling?
Tiling means that we chop up a large (sometimes
really, truly, huge) bitmap into smaller more manageable bitmaps that can later be put together to appear as one seamless image again. Tiling is used since it would not be possible to render those huge bitmaps (too large to keep in memory), and because time to transfer the bitmap to a client would be unacceptable. Also, the client rarely looks at the entire map area, and only need small parts of it.
A contract for tiling
To make tiling possible, we need to set a standard for how to reference a certain part of the larger bitmap - if the client needs to show a certain geographic area, it needs to know:
- Tile size and scales: how many tiles fit into that area
- Tile origin: what the (projected) coordinates of those tiles' corners are
- Grid alignment: given the tile grid origin, in what directions do the row and column coordinates of the grid grow?
- Tile naming: how to request a tile from the server, given its row and column coordinate in the grid
These four points constitute a contract about how tiling is done, and server and client need to agree on this.
For the spherical Mercator projection, Google Maps has set up what has ended being a de facto standard for tiling in this projection. This standard makes it easy to use spherical mercator with many different combinations of map clients and tile servers, since the contract is well defined, well documented and implemented almost everywhere (some variations exist, more on that later).
For other projections, this represents more of a challenge: all of the points above can be specified in a number of ways. We need to break down the points to something we can express in code.
Tile size and scales
We first have to agree on how large each tile is, both in pixels and in projected coordinates.
Deciding the tile size in pixels is fairly easy. Google Maps uses 256x256 pixels, and if you don't have any particular reason to do otherwise, so should probably you.
The size of a tile in projected coordinates is somewhat trickier. Another way of formulating this is: what zoom/scale levels do you need. Each level will result in a different tile size in projected coordinates.
For example, let's say that you have a level with the scale of one pixel per 100 projected coordinates (scale 1:100). If your tile size, in pixels, is 256x256, the tile size in projected coordinates will be 256 / (1/100) = 256x100 = 25 600 projected coordinate units.
The other way around, you can take projected coordinate units and multiply them by scale to get pixels: 25 600 projected coordinate units = 25 600x(1/100) = 256 pixels.
To sum up, we need to specify these two things:
- The tile size in pixels
- The scale for each zoom/scale level.
Tile origin
Tiles are organized in a grid. The rows and columns of the grid are numbered, and to make this numbering unambiguous, we need to define where in the projected coordinate space the grids origin (0,0) is.
Each projection transforms a certain area of the earth into a certain coordinate space. This coordinate space varies for each projection. Take for example
EPSG:2400 (Swedish coordinate system RT90). It is well defined for latitudes 55.2 to 69.1 degrees north, and longitudes 10.57 to 24.18 degrees east. This is projected to the x-coordinates 1166653.6161 to 2032341.6763 and y-coordinates 6131388.6471 to 7690505.5552. In this case, it might be suitable to choose an origin at top left (1166653.6161, 7690505.5552) or bottom left (1166653.6161, 6131388.6471). Or you might even define the origin as (0,0), or any other coordinate that suits you. The important thing is that client and server agrees on the origin, or they will actually use two different grids.
Grid alignment
To further define the grid, we need to decide how rows and columns in the grid are numbered. We know the coordinate of the origin of (0,0), but what does it mean, in terms of projected coordinates, to increment the row or column coordinate?
In the world of spherical Mercator, there are to approaches here:
- Google Maps and OpenStreetMap set the grid's origin at the top left and row coordinate grows downward, such that the row coordinate grows the further south you go. Columns grow from west to east (left to right).
- TMS (Tile Map Service) set the origin at bottom left, such that the row coordinate grows the further north you go. Columns grow from west to east (left to right), like Google Maps.
Tile naming
Given the definitions above, we can unambiguously calculate the grid row and column for a projected coordinate. What remains is how to request this tile from the server. This basically boils down to deciding on a naming standard for the tiles.
One of the most popular, employed by both Google Maps/OSM and TMS is often summarized as
xyz. This standard calls the row
y, the column
x and the zoom level
z, where zoom levels are numbered from 0 (most zoomed out, largest scale) and more zoomed in with increasing numbers. An example of a tile can look like this:
http://mytileserver.com/sweden/3/127/32.png
A great number of naming strategies exist, instead of using the rows and columns, the projected coordinate of one of the tile's corners can for example be used. Zoom level can be denoted by the actual scale used, or resolution (that is, effectively the inverse of the scale).
Getting down to details
This is all fine and well, but also very theoretical. How do we actually implement this, if we want to use our own definition instead of spherical Mercator?
A widely used and pretty flexible way to break this problem down is to use these four components:
- Projection - projects latitude and longitude to x/y
- Scale definitions - defines what zoom levels are available and the scale for each level
- Coordinate to grid transformation matrix - describes how a projected coordinate is transformed to a row and column in the grid
- Tile naming template - given zoom level, row and column forms the filename, URL, et c. for the tile
Projection
Projection can be done in a lot of ways. One of the most flexible is to use an implementation of
Proj.4 for the language you're working in. At Kartena, we use
Proj4Js in Javascript and
pyproj for Python.
spatialreference.org has Proj.4 definitions for all frequently used coordinate reference systems.
Scale definitions
Depending on your requirements, this can either be a list of your zoom levels' scales, or a function, if zoom levels follow such a pattern.
Coordinate to grid transformation matrix
Getting projected coordinates to grid coordinates involves first applying the grid origin and the grid alignment, and then the scale to convert the projected coordinate to pixel coordinates.
These are all so called linear transformations, which can be expressed by these formulas:
grid_col = int(scale * (a * proj_x + b))
grid_row = int(scale * (c * proj_y + d))
where
scale is the current scale level and
a, b, c and
d are constants; these constants can be expressed as a
transformation matrix.
For spherical Mercator, this matrix looks like this: (0.5 / π, 0.5, -0.5 / π, 0.5). This can be interpreted as the origin is at (
b,
d) = (0.5, 0.5). Both x and y axis is scaled by a factor of 0.5 / π, but the y axis is inverted (grows from north to south) since
c has a negative sign.
At first, this transformation might be the hardest one to grasp (especially if you're not a fan of math). To make it easier, here are two variants of the transformation matrix that generally works well for many local projections.
Local projection with google maps/OSM tiling scheme
For a local projection where you want to use the Google Maps/OpenStreetMap tiling scheme, where rows grow from north to south (and your projected coordinates go the other way, so that y grows further north), you want to do this:
- Set origo at the top left of the covered area (the point furthest north and west). Call this (origo_x, origo_y)
- The transformation matrix is: (1, origo_x, -1, origo_y)
LOCAL PROJECTION WITH TMS TILING SCHEME
For a local projection where you want to use the TMS tiling scheme, where rows grow from south to north (and your projected coordinates go the same way, so that y grows further north), you want to do this:
- Set origo at the bottom left of the covered area (the point furthest south and west). Call this (origo_x, origo_y)
- The transformation matrix is: (1, origo_x, 1, -origo_y)
Tile Naming Template
This is usually one of the easiest steps, usually just a set of string replacements.
Practical example
Wow, you've almost reached the end! Let's take a quick look how this might look in practice.
At Kartena, our favourite map client is currently
Leaflet. Our only real problem with it, was that out of the box it doesn't support any local projections. To solve this, we have written a small project called
Proj4Leaflet, that acts as glue between Leaflet and Proj4Js. With this project, and the information above, you can easily have tiling maps with any projection supported by Proj.4.
Using what we've talked about above, we can put this all together in a few lines of code:
var resolutions = [8192, 4096, 2048, 1024, 512, 256, 128, 64, 32, 16, 8, 4, 2, 1, 0.5]
,crs = L.CRS.proj4js('EPSG:2400'
    ,'+lon_0=15.808277777799999 +lat_0=0.0 +k=1.0 +x_0=1500000.0 +y_0=0.0 +proj=tmerc +ellps=bessel +units=m +towgs84=414.1,41.3,603.1,-0.855,2.141,-7.023,0 +no_defs'
    ,new L.Transformation(1, 0, -1, 0))
    ,scale: function(zoom) {
      return 1 / resolutions[zoom];
    }
    [...]
})
,mapUrl = 'http://api.geosition.com/tile/lmv/{z}/{x}/{y}.png'
First, we define the resolutions that we are going to use for the different zoom levels. Note that resolution (meters/pixel) is the inverse of scale (pixels/meter). This is reflected by the use of our custom scale function, which returns the inverted value.
We then set up the CRS (Coordinate Reference System) with its name, "EPSG:2400", and the Proj.4 definition (the really long string).
Next, we set up the transformation matrix, exactly as described above. In this case, we have put origo at (0,0) and use the Google Maps/OSM tiling scheme, with rows growing from north to south. (Note that this results in row coordinates being negative; this is something we use for the "cleanness" of using a simple origo as (0,0)).
The last line is the string template for getting the actual tile URL, following the xyz scheme mentioned above.